Automate Marketing Reports to Slack with AI
Pull GA4 and ad data, let AI summarize it, send alerts and a weekly digest to Slack. A reliable pipeline with no made-up numbers.
Most automated marketing reports fail in one of two ways. Either they dump a wall of numbers into Slack that nobody reads, or someone wires a language model to the data and it cheerfully reports a 23% lift that never happened. I build marketing automation for a living, and the pattern that survives contact with real teams is boring on purpose: code pulls and calculates, the model only explains, and alerts and digests are two separate things.
This guide walks through the whole pipeline: what deserves a Slack message, how to pull GA4 and ad platform data, how to keep the model away from arithmetic, how to write the summary prompt, how to build alerts and a weekly digest in Block Kit, and how to keep it all running when an API has a bad day.
TL;DR
Pull data on a schedule, compute every number and week-over-week delta in code, and hand the model finished facts to narrate. Validate that every number in its output exists in the input. Send threshold alerts immediately to one channel and a weekly digest to another. Use an incoming webhook for simple posts and a bot token when you need threads, updates or file uploads. Review the first few runs by hand, and keep a human on every anomaly alert.
In This Guide click to collapse
What to report, to whom, and how often
Decide who reads the message and what they do next. A message that changes nobody’s action is noise. I split reporting into two products:
- The alert: goes to the people who can fix things today (a channel like
#marketing-alerts). Short, triggered by a rule, never scheduled. - The digest: goes to the wider team once a week (a channel like
#marketing-weekly). Scheduled, narrative, with links to drill down.
Then limit the metrics. Five to eight numbers is plenty for a Slack message. Everything else belongs in a dashboard.
| Metric | Source | Cadence | Example alert threshold |
|---|---|---|---|
| Sessions (by channel group) | GA4 | Daily check, weekly digest | z-score below -2.5 vs 8-week baseline |
| Key events (conversions) | GA4 | Daily check, weekly digest | Down more than 30% vs same weekday average |
| Revenue or lead value | GA4 or CRM | Weekly digest | Down more than 25% week over week |
| Ad spend and cost per result | Ad platform | Daily check, weekly digest | Spend above 130% of daily budget |
| Organic clicks and impressions | Search Console | Weekly digest | Clicks down more than 20% over two weeks |
| Tracking health (events received) | GA4 | Daily check | Zero key events for 24 hours |
The last row matters more than it looks. Many “traffic crashes” turn out to be broken tracking.
Architecture of the pipeline
The pipeline has one rule: the model sits at the end, not the middle. Everything upstream is deterministic code you can test. After the metric engine computes the numbers, the flow splits: alert rules run every execution and post breaches straight to Slack, while the weekly digest builder has the model narrate the computed facts, checks the result, and posts.

For exploration and one-off questions, connecting Claude to your accounts through MCP works well (see MCP for marketers). For a recurring report, a plain scheduled script is more predictable.
Pulling data from GA4 and ad platforms
GA4 exposes a Data API with an official Python client. Create a service account, give it Viewer access on the GA4 property, and point GOOGLE_APPLICATION_CREDENTIALS at its key file. Request the current week and the previous week as separate calls so the shape of the response stays trivial.
from google.analytics.data_v1beta import BetaAnalyticsDataClient
from google.analytics.data_v1beta.types import DateRange, Metric, RunReportRequest

client = BetaAnalyticsDataClient()

def pull_totals(property_id: str, start: str, end: str) -> dict:
    request = RunReportRequest(
        property=f"properties/{property_id}",
        date_ranges=[DateRange(start_date=start, end_date=end)],
        metrics=[
            Metric(name="sessions"),
            Metric(name="keyEvents"),
            Metric(name="totalRevenue"),
        ],
    )
    response = client.run_report(request)
    row = response.rows[0].metric_values
    return {
        "sessions": float(row[0].value),
        "key_events": float(row[1].value),
        "revenue": float(row[2].value),
    }

this_week = pull_totals("123456789", "7daysAgo", "yesterday")
last_week = pull_totals("123456789", "14daysAgo", "8daysAgo")
Ad platforms follow the same pattern: a read-only credential, a date range, a small set of metrics (spend, clicks, conversions) and a normalization step that turns each platform’s response into your own flat structure. Normalize early so the metric engine does not care where a number came from.
Watch the API quotas and data latency
The GA4 Data API uses token-based quotas per property, shared with every other tool connected to it, and ad platforms have their own developer-access rules and rate limits. Check the current docs before adding per-campaign breakdowns. Recent GA4 data can also still change, so I report on complete days ending yesterday, never “today so far”.
Compute first, narrate second
Language models are unreliable at arithmetic and, worse, confident about it. The fix is not a better prompt. The fix is never asking. Compute every delta, ratio and rank in code, round it the way you want it displayed, and store the result as the single source of truth.
def pct_change(current: float, previous: float):
    """Return percent change, or None when it is undefined."""
    if previous == 0:
        return None
    return round((current - previous) / previous * 100, 1)

def build_facts(this_week: dict, last_week: dict, period: str) -> dict:
    metrics = {}
    for name, current in this_week.items():
        previous = last_week[name]
        metrics[name] = {
            "current": round(current, 2),
            "previous": round(previous, 2),
            "change_pct": pct_change(current, previous),
        }
    return {"period": period, "metrics": metrics}
Note the None for undefined change: a model handed a divide-by-zero will invent something plausible, so give it an explicit null instead.
The rule that prevents invented figures
The model receives finished numbers and writes sentences around them. It does not add, subtract, average, compare or rank anything. If a sentence needs a number, that number must already be in the facts object. Then you verify it with code, as shown below.
The summarization prompt
A good report prompt is mostly constraints. State the audience, fix the structure, list what the model may and may not claim, and give it the facts as JSON.
SYSTEM = """You write the weekly marketing summary for a team Slack channel.

Rules:
- Use ONLY numbers that appear in the FACTS JSON. Copy them exactly.
- Never calculate, estimate, round, or compare numbers yourself.
- If change_pct is null, say the change cannot be computed. Do not guess.
- Never state a cause. You may say what changed, not why it changed.
  If asked for causes, write "possible factors to check:" and list questions.
- Output plain text: one headline sentence, then at most 3 bullets,
  then one line starting "Check next:" with a single suggested action.
- Tone: direct, neutral, no hype words, no emojis.
"""

def summarize(facts: dict) -> str:
    import json, os, anthropic
    client = anthropic.Anthropic()
    message = client.messages.create(
        model=os.environ["REPORT_MODEL"],   # pick a small, cheap model
        max_tokens=400,
        system=SYSTEM,
        messages=[{"role": "user", "content": "FACTS:\n" + json.dumps(facts)}],
    )
    return message.content[0].text
A worked example. Given sessions of 12,480 this week against 11,200 last week, the facts carry change_pct: 11.4 computed by your code. A good output reads: “Sessions rose 11.4% to 12,480. Check next: review which channel group drove the growth.” Every figure is traceable.
Now the part most tutorials skip: verify the output. Extract every number from the generated text and confirm it appears in the facts, allowing for the formatting you expect.
import re

def allowed_numbers(facts: dict) -> set:
    found = set()
    for m in facts["metrics"].values():
        for key in ("current", "previous", "change_pct"):
            v = m[key]
            if v is not None:
                found.add(f"{abs(v):,.2f}".rstrip("0").rstrip("."))
                found.add(f"{abs(v):.1f}".rstrip("0").rstrip("."))
                found.add(f"{abs(v):,.0f}")
    return found

def numbers_are_grounded(text: str, facts: dict) -> bool:
    allowed = allowed_numbers(facts)
    for token in re.findall(r"\d[\d,]*\.?\d*", text):
        if token.strip(",.") not in allowed:
            return False
    return True
If validation fails, retry once. If it fails again, post a plain template built from the facts with no prose. A boring message with correct numbers always beats an eloquent one with a wrong number. For the broader principle of gating what an AI system is allowed to do, see my guide on human-in-the-loop approval gates.
Anomaly alerts that people trust
An alert channel dies the first week it cries wolf. Two design choices keep it alive: pick the right rule per metric, and add dedupe and quiet hours.
| Rule type | How it works | Good for | Weakness |
|---|---|---|---|
| Fixed percentage | Fires when a metric moves more than X% vs the previous period | Revenue, spend vs budget | Noisy on low-volume days, ignores seasonality |
| Z-score on a rolling baseline | Fires when a value is more than N standard deviations from the mean of the last 8 comparable days or weeks | Sessions, key events, clicks | Needs enough history; weak on new properties |
| Hard floor or ceiling | Fires when a value is zero, or above a budget cap | Tracking health, runaway spend | Only catches extremes |
from statistics import mean, pstdev

def zscore(value: float, history: list) -> float | None:
    if len(history) < 6:
        return None          # not enough data, do not alert
    sd = pstdev(history)
    if sd == 0:
        return None
    return round((value - mean(history)) / sd, 2)

def should_alert(value: float, history: list, threshold: float = 2.5) -> bool:
    z = zscore(value, history)
    return z is not None and abs(z) >= threshold
Compare like with like: build the history from the same weekday when traffic has a weekly pattern.
Then add three guards around the rule:
- Dedupe: store a key such as
metric + date + directionand skip if it was already posted. Suppress repeats for 24 hours. - Quiet hours: queue non-critical alerts until working hours. Reserve overnight posts for hard failures like zero tracking events or spend above the cap.
- Context in the message: metric, current value, baseline, the rule that fired, and a link to the drill-down. Do not let the model decide whether to alert. Rules decide. The model can add a one-line “possible factors to check”, labelled as such.
Alerts inform, humans decide
An anomaly alert is a prompt to look, not an instruction to act. Do not auto-pause campaigns, change budgets or edit bids from an alert. Let a named owner confirm whether the anomaly is real (a launch, a holiday, a tracking change) before anything changes, and put any later automated action behind an approval step.
The weekly digest in Block Kit
Slack’s Block Kit gives you structured layouts: a header, sections with fields for side-by-side numbers, a divider, and context for small print and links. Build the payload from the facts object, with the model’s text dropped into one section.
def build_digest_blocks(facts: dict, summary: str, dashboard_url: str) -> list:
    def fmt(name, label):
        m = facts["metrics"][name]
        change = m["change_pct"]
        arrow = "n/a" if change is None else f"{change:+.1f}%"
        return {"type": "mrkdwn",
                "text": f"*{label}*\n{m['current']:,.0f} ({arrow})"}

    return [
        {"type": "header",
         "text": {"type": "plain_text", "text": f"Weekly marketing digest: {facts['period']}"}},
        {"type": "section", "text": {"type": "mrkdwn", "text": summary}},
        {"type": "section", "fields": [
            fmt("sessions", "Sessions"),
            fmt("key_events", "Key events"),
            fmt("revenue", "Revenue"),
        ]},
        {"type": "divider"},
        {"type": "context", "elements": [
            {"type": "mrkdwn", "text": f"Numbers computed from GA4. <{dashboard_url}|Open dashboard>"}
        ]},
    ]
The numbers in the fields come from code, and the model’s paragraph sits above them. Always include a plain text fallback field in the payload, which Slack uses for notifications.
Incoming webhook or bot token?
| Incoming webhook | Bot token (chat.postMessage) |
|
|---|---|---|
| Setup | One URL per channel, minutes to configure | Create a Slack app, add scopes, install it, invite it to the channel |
| Post to multiple channels | One webhook per channel | One token, channel set per call |
| Update or delete a message | No, the response has no message timestamp | Yes, you get the timestamp back |
| Threads (for example alert follow-ups) | Difficult without a timestamp | Yes |
| File and chart uploads | No | Yes, with the right scopes |
| Secret to protect | The webhook URL | The token |
My rule: start with a webhook for the digest because it is the fastest path to a working message. Move to a bot token when you want alert threads (“resolved” replies under the original alert), edited messages, or chart uploads. Keep the URL or token in an environment variable, never in the repo.
import os, requests

def post_webhook(blocks: list, fallback: str) -> None:
    r = requests.post(
        os.environ["SLACK_WEBHOOK_URL"],   # https://hooks.slack.com/services/...
        json={"text": fallback, "blocks": blocks},
        timeout=10,
    )
    r.raise_for_status()

def post_bot(blocks: list, fallback: str, channel: str) -> str:
    r = requests.post(
        "https://slack.com/api/chat.postMessage",
        headers={"Authorization": "Bearer " + os.environ["SLACK_BOT_TOKEN"]},
        json={"channel": channel, "text": fallback, "blocks": blocks},
        timeout=10,
    )
    data = r.json()
    if not data.get("ok"):
        raise RuntimeError(data.get("error", "slack error"))
    return data["ts"]   # keep this to thread or update later
For charts, Block Kit has an image block that needs a publicly reachable image URL, so render the chart (for example with a plotting library) and host it somewhere your team can load it. With a bot token you can alternatively upload the file. Slack limits the number of blocks per message and the size of text fields, and posting is rate limited to roughly one message per second per channel, so keep the digest compact and check the current Slack docs for exact limits. Link out to the dashboard instead of trying to cram a full report into the message.
Reliability and the human check
The scheduled part is the easy part. Trigger the job with cron, a CI scheduler or your automation platform, at the same time every week and ideally after the data has settled. A simple cron entry runs the digest on Monday morning:
0 8 * * 1  cd /opt/marketing-reports && /usr/bin/python3 digest.py >> logs/digest.log 2>&1
0 */4 * * * cd /opt/marketing-reports && /usr/bin/python3 alerts.py >> logs/alerts.log 2>&1
What matters is the failure path. A report that silently fails to arrive is worse than none.
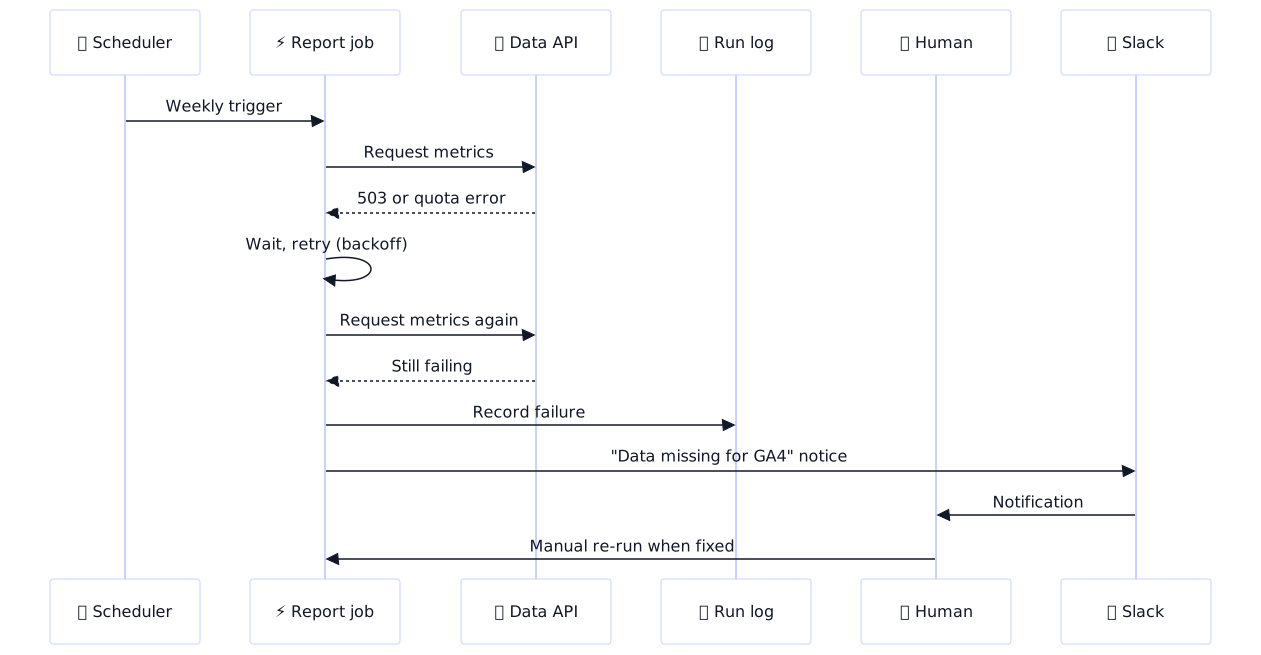
- Retries with backoff: retry transient errors (timeouts, 5xx, rate limits) two or three times with increasing delays. Respect the retry hint when Slack or an API returns a rate limit response.
- Missing-data messages: if a source is down, post “GA4 data unavailable for this run, will retry” rather than skipping it. Partial digests should say which section is missing.
- Logging: save the facts object, the model output, the validation result and the Slack response for every run. When someone asks “where did that number come from”, you can answer in seconds.
- Idempotency: key each digest by ISO week so a re-run does not double-post.
First-weeks review checklist
- For the first 3 to 4 runs, post the digest to a private test channel and compare every number against the source dashboard.
- Confirm the validator rejects a deliberately corrupted summary, and a forced API failure produces the “data missing” message.
- Replay a past week with a known anomaly and confirm the alert would have fired once, not five times.
- Name an owner for the alert channel and agree what “acknowledged” means.
- Promote to the real channel only after a clean run of weeks.
Tooling options and costs
The logic is the same everywhere; what changes is who maintains it.
| Option | Strengths | Trade-offs | Best for |
|---|---|---|---|
| n8n | Self-hostable, code nodes for the metric logic, good Slack and HTTP nodes | You run and update it; complex logic can sprawl across nodes | Teams that want visual workflows plus real code |
| Make | Quick to build, large connector catalog | Cost scales with operations; calculations are clumsy in modules | Simple digests, non-technical owners |
| Zapier | Easiest start, many integrations | Gets expensive with multi-step runs; limited control over validation | Light alerts and notifications |
| Small script plus cron | Full control, testable, cheapest to run | You own deployment and monitoring | Anyone comfortable with Python |
On cost, the model is the smallest line item. A weekly digest sends a few hundred tokens in and a few hundred out, so a small model is plenty and the spend is trivial, even with a retry. The real costs are platform pricing and maintenance time; check current pricing for your choices. If you want this built and maintained for you, that is what my marketing automation work covers, and the same pipeline pattern powers channel reporting for YouTube and search reporting for SEO.
To close the loop, so a teammate can ask a follow-up in Slack and an agent fetches more data, see the Slack AI agent workflow from request to report, and the broader agent systems I build use the same rule: code for facts, models for language, humans for decisions.
FAQ
How do I send automated GA4 reports to Slack?
Pull the numbers with the GA4 Data API from a scheduled script or workflow, compute week-over-week changes in code, format them as a Slack Block Kit message, and post it through an incoming webhook or a bot token with chat.postMessage. Run it on cron or your automation tool's scheduler. Use a service account with read-only access to the GA4 property.
Can AI write my weekly marketing report?
Yes, for the narrative part. Compute every figure in code, pass the finished numbers to the model as structured data, and have it write a short summary that only uses those numbers. Then validate the output against the source data before posting. Let the model explain the numbers, never produce them.
How do I set up marketing performance alerts in Slack?
Define a small set of rules per metric, such as a fixed percentage drop for revenue or a z-score against a rolling 8-week baseline for sessions. Run them on a schedule, deduplicate so the same breach is not posted twice, respect quiet hours, and post to a dedicated alerts channel with a link to the drill-down. Keep alerts separate from the weekly digest.
How do I stop an AI from making up numbers in reports?
Never ask the model to calculate. Compute all figures and deltas in code, give the model only that structured data, forbid any number not in the input, and run a validator that extracts every number from the output and checks it against the input. If validation fails, retry once, then fall back to a plain template without prose.
Which tool is best for marketing reporting automation: n8n, Make or Zapier?
It depends on who maintains it. n8n suits teams that want self-hosting and code nodes for the metric logic. Make and Zapier are faster to start and fine for simple digests. A small script on cron gives the most control and the cheapest running cost. Whichever you pick, keep the calculations in code, not in a prompt.
How often should a marketing digest be sent?
Weekly is the right default for most teams, on a fixed weekday morning before the planning meeting. Keep daily messages for threshold alerts only. A monthly roll-up can sit on top for leadership. If nobody reacts to a message for a month, reduce its frequency or cut it.
How do I format Slack messages with charts?
Use Block Kit for the layout: a header, section blocks with fields for the metrics, and context blocks for links. For charts, render an image yourself and either host it at a public URL for an image block or upload it with a bot token. Webhooks cannot upload files, and block and size limits apply, so check the current Slack docs.